How to read a lab report
A lab report is written for the clinician who ordered it. It is dense, abbreviated, and laid out to be scanned in seconds by someone who has read thousands of them. Now that results usually reach your portal as soon as they are final, you are often the first person to see yours, without that practice.
The good news is that almost every report follows the same structure, whichever lab produced it. Once you know where to look and what each column is telling you, the page gets a lot less intimidating. This guide walks through it from top to bottom.
The top of the page
The header is easy to skip, and it holds some of the most useful information on the report.
- Your name, date of birth, and an ID number. Check them. Mix-ups are rare, but this is the only place you would catch one.
- Ordering provider. The clinician who requested the tests, and who receives the results.
- Collected, received, and reported dates. Collected is when the sample left your body. Received is when it reached the lab. Reported is when the result was final. The collected date is the one that matters for your history. It can be days earlier than the reported date, and a corrected report can be reissued later still.
- Fasting status and specimen type. Whether you were fasting, and whether the sample was blood, urine, or something else. Not every report prints these.
- The performing lab. The name and address of the laboratory that ran the test. A report from one company can include tests run at several sites, each marked with a short code next to the result and listed in full at the bottom.
In the United States, federal lab regulations set the minimum a report must show: who the patient is, which lab performed the test, the report date, the test, the result, and its units (42 CFR 493.1291). Everything else is the lab’s choice of layout, which is why two reports can look so different while saying the same things.
The results table
The body of the report is a table with one row per test. Here is a made-up excerpt in a typical layout:
| Test | Result | Flag | Reference interval | Units |
|---|---|---|---|---|
| Glucose | 104 | H | 70–99 | mg/dL |
| Creatinine | 0.92 | 0.57–1.00 | mg/dL | |
| eGFR | 78 | >59 | mL/min/1.73m² | |
| Potassium | 4.3 | 3.5–5.2 | mmol/L | |
| ALT | 31 | 0–32 | IU/L | |
| TSH | 2.10 | 0.450–4.500 | uIU/mL |
Labs order and name these columns differently, and some print out-of-range results in a separate column instead of using a flag. The five pieces of information are the same.
Test name
What was measured. Names are often abbreviated, and the same test goes by different names at different labs: “Hemoglobin A1c”, “HbA1c”, and “A1C” are one test. Tests are usually grouped under the panel they were ordered in, such as a Comprehensive Metabolic Panel, with the individual tests indented beneath.
Result
Your value. This is the only part of the row that is about you. Everything else in the row is there to help interpret it.
Units
What the number is counted in. A result means nothing without its unit. Glucose is reported in mg/dL in the United States and in mmol/L in much of the world, and 99 mg/dL is about 5.5 mmol/L. If you ever compare a result with an older one, or with a number you read somewhere, check the units first.
Reference interval
The range the lab compares your result against. It is also called the reference range or normal range. This column causes the most confusion, so it has its own section below.
Flag
A mark showing that the result fell outside the reference interval. Common ones:
| Flag | Meaning |
|---|---|
| H | Higher than the reference interval |
| L | Lower than the reference interval |
| A or * | Abnormal, used for results that are not numbers |
| HH, LL, C, or “Critical” | Far enough outside to need prompt attention |
Some labs use bold type, color, or an arrow instead of a letter. No flag means the result was inside the interval.
A critical flag is a different thing from an ordinary H or L. Labs are required to alert the person who ordered the test immediately when a result reaches a critical value, so your clinician will already have been contacted about it.
What a reference range actually is
A reference range is not a line between healthy and sick. For most tests, the lab takes results from a large group of healthy people and uses the middle 95 percent as the range. Three things follow from that.
Healthy people fall outside it all the time. By construction, about one healthy person in twenty lands outside the range on any single test. A routine blood draw can easily include twenty tests or more. If the tests were independent of each other, the chance of at least one flag somewhere on a twenty-test report would be about two in three, for a person with nothing wrong.
Ranges differ between labs. Each lab sets its own, based on its instruments, methods, and reference population. The same result can be flagged at one lab and unflagged at another. Many ranges also depend on age and sex, so the range printed on your report may differ from the one on a family member’s. Read your result against the range printed next to it, not one from another report or from a website. MedlinePlus, from the National Library of Medicine, makes the same point in How to Understand Your Lab Results.
Some “ranges” are not reference ranges at all. For cholesterol, glucose, and hemoglobin A1c, the number printed in that column usually comes from clinical guidelines, not from the middle 95 percent of healthy people. An LDL cholesterol range of “0–99” is a target. An A1c of 5.7 percent is a diagnostic threshold. These cutoffs are the same from lab to lab, and they describe risk, so being a little over means something different from being a little outside a statistical range.
What a flag does not tell you
A flag is a yes-or-no answer to a narrow question: is this number outside the printed range? It leaves out most of what matters.
- How far outside. In the excerpt above, a glucose of 104 against a limit of 99 gets the same H as a glucose of 250.
- How close inside. The ALT of 31 against a limit of 32 gets no flag at all.
- Which direction you are moving. A value that has climbed every year for five years and a value that has not moved in five years look identical on today’s report.
- Why. Recent illness, hard exercise, a meal, the time of day, medications, supplements, and the menstrual cycle all move results. So does not fasting for a test that expects it. Your cycle shows up in your labs covers one of these in detail.
So a flag is a prompt to look closer, not a diagnosis. And the absence of a flag is not a guarantee.
Results that are not plain numbers
Not every row has a number you can compare with a range.
- “<0.1” or “>90”. The value was beyond what the method can measure, or beyond what the lab reports. “<0.1” does not mean 0.1. It means lower than that, by an unknown amount.
- Negative, Positive, Not Detected, Nonreactive. Yes-or-no tests. The reference column shows the expected answer, usually “Negative”.
- Titers such as 1:80. How far the sample could be diluted and still give a positive result. A larger second number means more of what was being looked for.
- Calculated results. Some rows were worked out from other rows, not measured. LDL cholesterol is often calculated from total cholesterol, HDL, and triglycerides, and the calculation is unreliable when triglycerides are very high, so the lab may leave it blank or measure it directly. eGFR, the usual kidney function estimate, is calculated from creatinine along with your age and sex. The equation behind it changed in 2021, which can shift the number between an older report and a newer one with no change in you. The National Institute of Diabetes and Digestive and Kidney Diseases describes the current equations.
- No result at all. “TNP” means test not performed. “QNS” means quantity not sufficient: there was not enough sample. “Hemolyzed” means red cells in the sample broke open, which distorts some tests, potassium in particular. These are problems with the sample, not findings about you, and the usual fix is a redraw.
Comments and footnotes
The small print under a result or at the bottom of the page is worth reading. It can include:
- The cutoffs the lab used, such as the A1c thresholds for prediabetes and diabetes.
- The method or equation used for a calculated value.
- A note that a result was confirmed by repeat testing.
- Notes on the sample, such as “specimen slightly hemolyzed” or “non-fasting”.
- A statement that a test was developed by the laboratory itself. This is standard regulatory wording and does not mean something was wrong with your test.
- The full names and addresses behind the performing-lab codes.
The panels you are most likely to see
A panel is a set of tests ordered together. These are the common ones on a routine report:
| Panel | What it looks at |
|---|---|
| Complete Blood Count (CBC) | Red cells, white cells, and platelets. “With differential” adds a breakdown of white cell types. |
| Basic Metabolic Panel (BMP) | Eight tests: glucose, calcium, electrolytes, and kidney markers. |
| Comprehensive Metabolic Panel (CMP) | The BMP plus six more, covering blood proteins and liver enzymes. |
| Lipid panel | Total, LDL, and HDL cholesterol, and triglycerides. |
| Hemoglobin A1c | Average blood sugar over roughly the past three months. |
| Thyroid tests | TSH, sometimes with free T4 and free T3. |
| Urinalysis | A urine sample checked for protein, glucose, blood, and signs of infection. |
Within a panel, results are meant to be read together. Your clinician looks at the pattern across related tests, which is something a row-by-row scan of the flags cannot show.
One report is one point
Everything above is about reading a single report. The largest limit of a single report is that it has nothing to compare itself with except a population range.
Your own earlier results are a better comparison. Most people’s values sit in a much narrower band than the reference range, so a change that is large for you can happen entirely inside the range and never draw a flag. And a result just outside the range means less if it has been sitting in the same place for ten years. Your doctor sees the labs they ordered explains why that comparison often is not available in the exam room.
So when a new report arrives, the most useful thing to do with it is put it next to the previous ones:
- Is this value different from my last few, or about the same?
- If it moved, is the move bigger than my results usually bounce around?
- Did anything change since the last draw, such as a medication, fasting, or an illness?
How to track your lab results over time is a step-by-step method for building that history, with a spreadsheet, an app, or paper.
What to ask about a result
If a result is flagged, or you do not understand it, these questions get specific answers:
- Is this result expected for me, given my history and medications?
- How far outside the range is far enough to matter for this test?
- Could anything about the draw have affected it, such as fasting, timing, or the sample?
- Should it be repeated, and when?
- What would you want to see at the next test?
If a critical result appears in your portal and you have not heard from anyone, call the ordering clinician’s office instead of waiting for a message.
Reading reports in HealthViewer
We make HealthViewer, so weigh this section accordingly.
HealthViewer is a lab results tracker that runs on your Mac or Windows computer. It reads lab report PDFs and pulls out the same columns described above: test name, value, unit, reference range, and collection date. Each result keeps the range that was printed on its own report, and is marked Normal, Borderline, or Abnormal against it, so a value sitting close to the edge is not shown the same way as one in the middle. It maps the different names labs print onto one test and converts units, so every result for a test lands on one chart with the range shaded behind it:
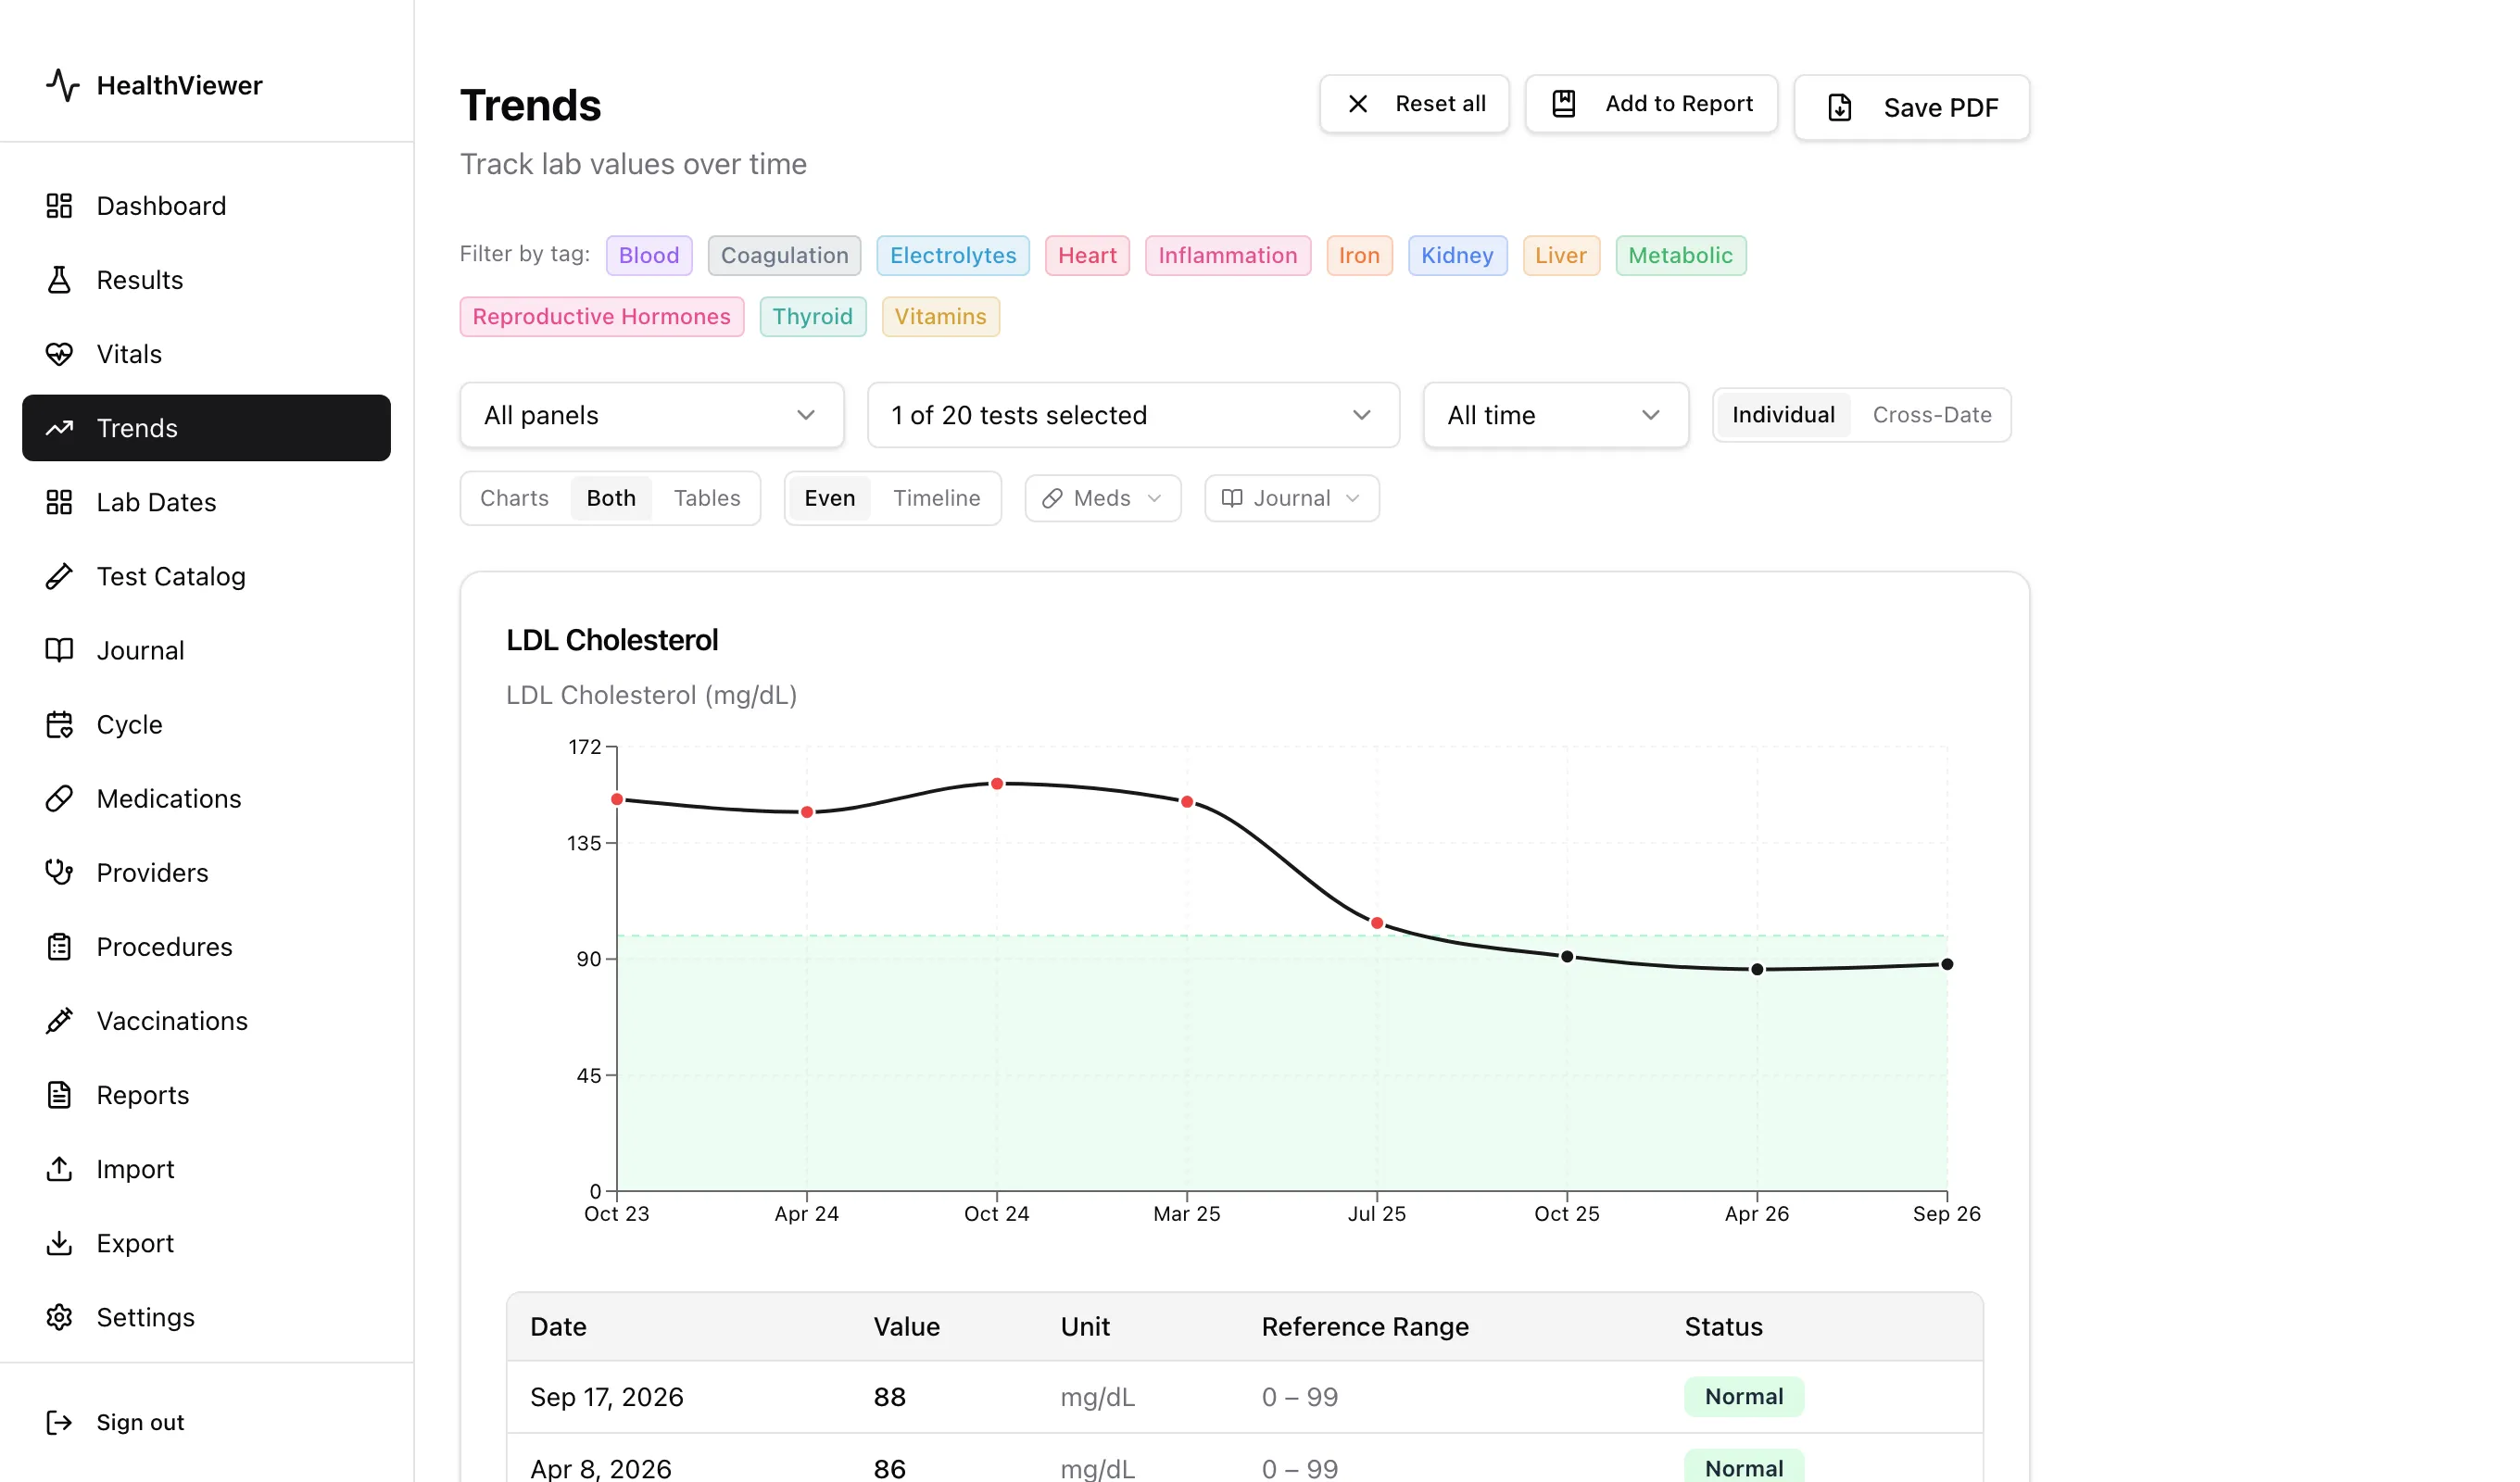
Example data: LDL cholesterol across eight draws, with the reference range shaded.
Everything is stored in one encrypted file on your computer, with no account and no cloud service. See Upload a PDF or CSV to import a report, or Trends for how the charts work. If you are deciding between this and a portal or a spreadsheet, Where should your lab results live? compares them.
This post is general information, not medical advice. It describes how lab reports are laid out, not what your results mean for you. Talk to your clinician about any result you have questions about.